System and Services metrics
Architecture
Software Factory provides systems metrics and service metrics for Nodepool and Zuul. The following diagram describes components used to provide metrics.

When you activate metrics on your deployment, 3 services will be deployed:
- Telegraf: a plugin-driven server agent for collecting and reporting metrics.. Metrics are collected on all nodes defined in the architecture file (/etc/software-factory/arch.yaml). An input plugin is configured to get statsd metrics from Zuul and Nodepool services.
- Influxdb: a time series database for storing metrics.
- Grafana: a platform for analytics and monitoring.
Deployment
These components are not deployed by default but can be activated by adding them in /etc/software-factory/arch.yaml:
You can deploy Grafana and Influxdb on different hosts if needed. Telegraf will be automatically deployed on all nodes defined in the arch.yaml file.
inventory:
   - name: managesf
     ip: 192.168.0.10
     roles:
       ...
       - influxdb
       - grafana
Then run sfconfig to deploy all components.
During the deployment, a database named telegraf will be created, configured to allow telegraf user to send data.
Influxdb database
Admin user can use Influx client to connect to Influxdb, only root user can get the password in secrets.yaml:
telegraf_passwd=$(awk '/telegraf_influxdb_password/ {print $2}' /var/lib/software-factory/bootstrap-data/secrets.yaml)
influx -ssl -host $influxdb_host -username telegraf -password $telegraf_passwd -database telegraf
Connected to https://$influxdb_host:8086 version 1.4.2
InfluxDB shell version: 1.4.2
>
Explore Telegraf database
- list measurements and series
> show measurements limit 5
name: measurements
name
----
cpu
disk
diskio
kernel
mem
- Query data
Influx queries are similar to sql syntax, it’s fully explained on the official cli documentation.
> select * from "zuul.tenant.local.pipeline.check.total_changes" limit 1
name: zuul.tenant.local.pipeline.check.total_changes
time                host                 metric_type value
----                ----                 ----------- -----
1518019090000000000 managesf.sftests.com counter     1
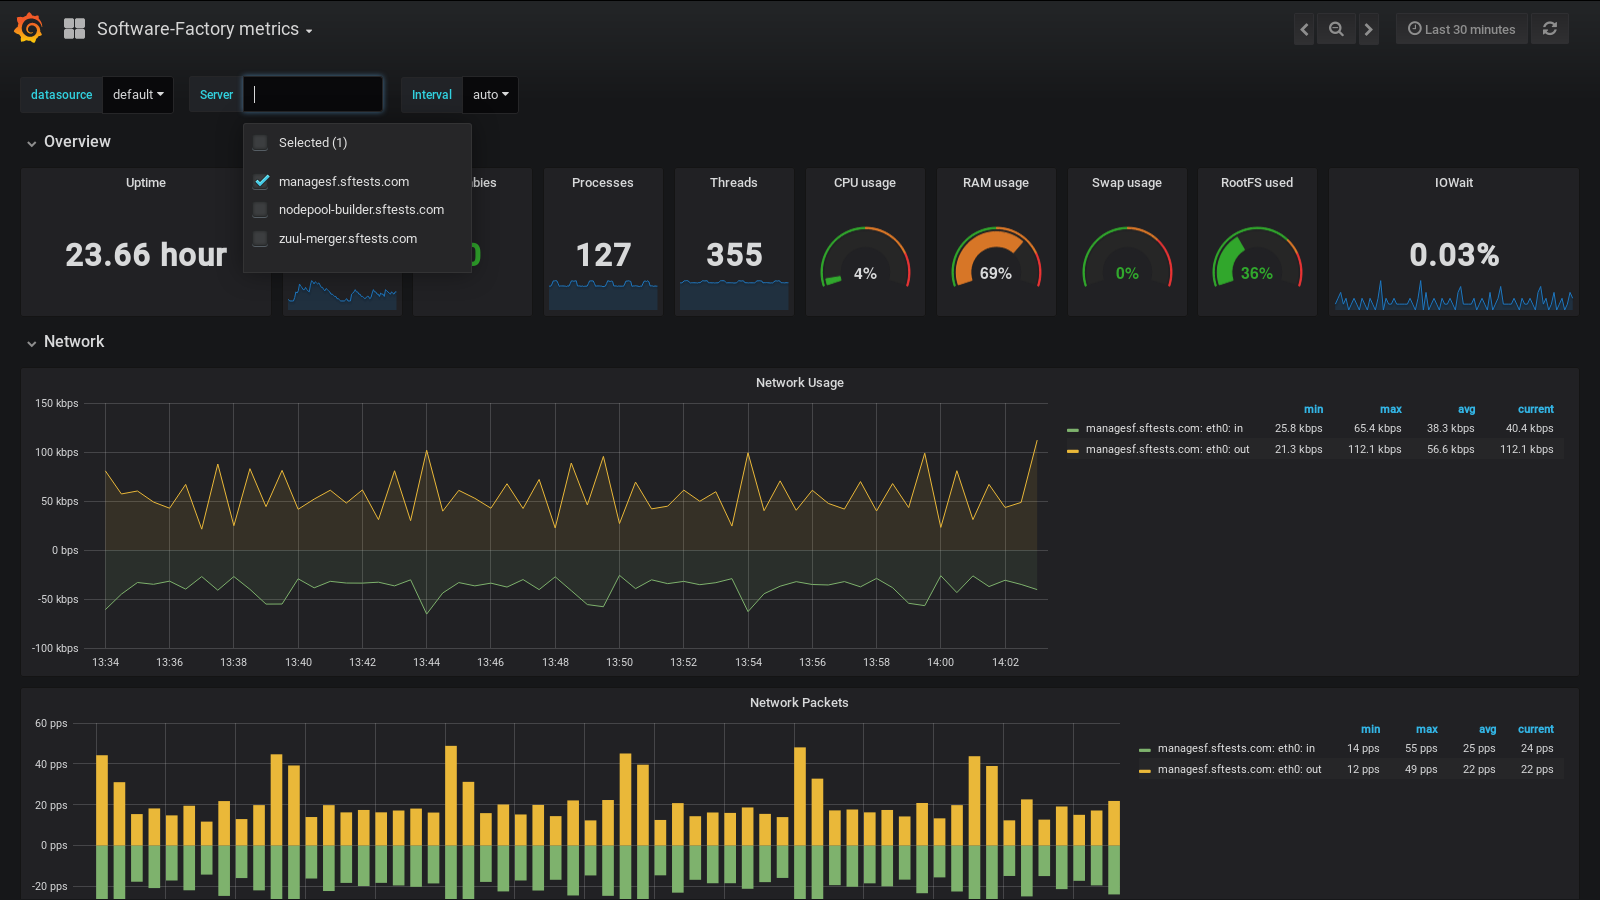
Dashboards access
There is a new item on the top menu, on the right side named “Status” to access the Grafana dashboard:
By default, all dashboards are read only. Only the admin user can add or modify a dashboard.
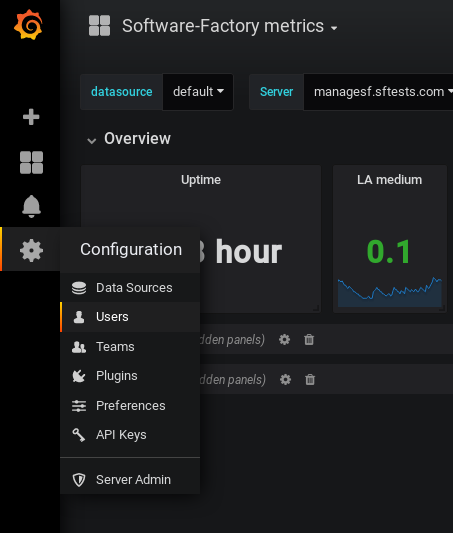
Allow users to manage dashboards
To allow user to manage dashboards, the admin needs to change the user role in the user role panel (screenshot). Set the role to Editor to allow user to manage dashboards.
Default dashboards
Software Factory comes with default dashboards for system, Zuul and Nodepool providers. These dashboards are automatically generated and can’t be modified by admin or users. You can use the metrics directory within the config repository to add user’s defined dashboards. These dashboards are generated from yaml files using grafyaml. You can find some documentation to add custom dashboards on the user documentation.